Modeling of patrol behavior of diacamma gamergate
OS11 Bio-inspired Theory and Application
OS11-5 Modeling of patrol behavior of diacamma gamergate
- ○Kazuyuki Yaegashi (Tohoku University,natural science NPO,Japan)
- Ken Sugawara (Tohoku Gakuin University,Japan)
- Tomonori Kikuchi(Ryukyu University,Japan)
- Kazuki Tsuji(Ryukyu University,Japan)
- Yoshikatsu Hayashi(natural science NPO,Japan)
Introduction
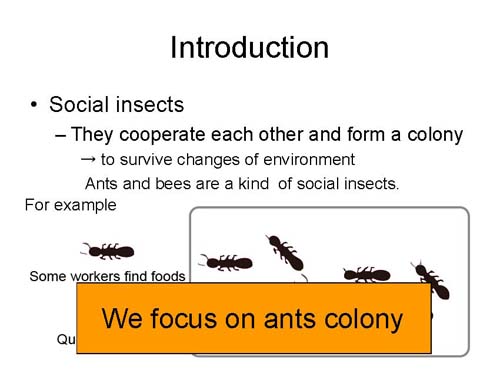
What is social insects? They cooperate each other and form a colony to survive changes of environment. Ants and bees are a kind of social insects. For example, in ants colony, workers find some foods, and queen lays eggs. So, today we focus on ants colony.
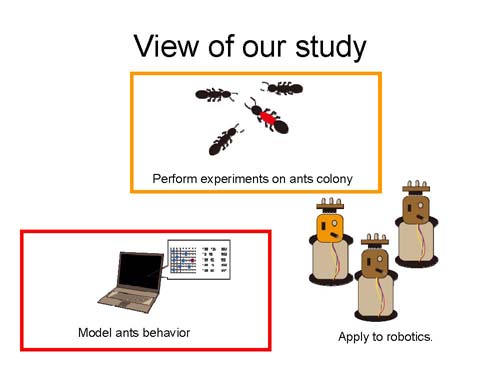
Next, I will talk about view of our study. First, we explain perfom experiments on ants colony. Second, based on experiment we explain model ants behavior. Third, in the future work, based on experiment we apply to robotics.
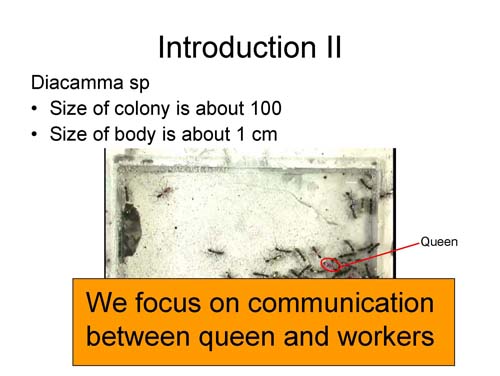
Next, I will talk about Diacama. Size of colony is about 100 cm. Size of body is about 1 cm. We focus on communication between queen and workers.
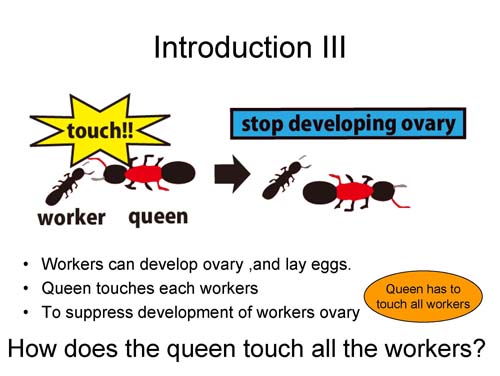
Workers can develop ovary, and lay eggs. Queen touches each workers to suppress development of workers ovary. So, queen has to touch all the wokrers. But, colony size is about 100. It is so big that queen can't count all workers. How does the queen touch all the workers?
Workers and queen walk and rest. Queen touches workers. (Showing video that daicamma's colony.)
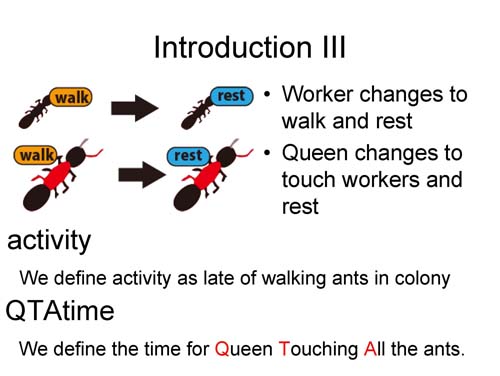
We define two words. One is activity. We define activity as late of walking ants in colony. Another is QTAtime. We define the time for Queen Touching All the ants.
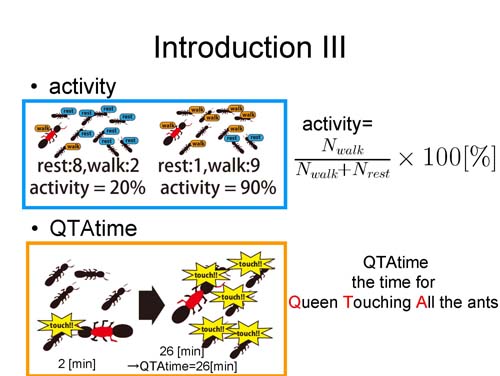
For example, when rest ants are 8, and wolking ant is 2, acitvity equal 20%. And, if queen take 26 minutes touchking all ants, QTAtime equal 26 minutes.
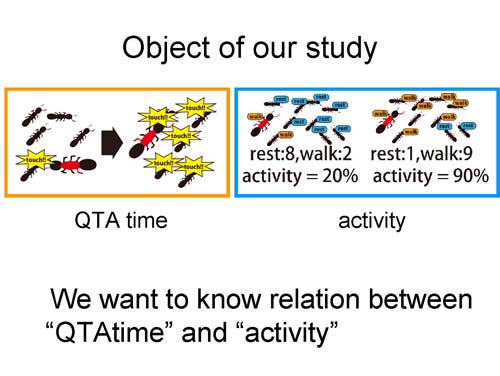
Next, I will talk about Object of our study. We want to know relation between "QTAtime" and "activity".
Experiment
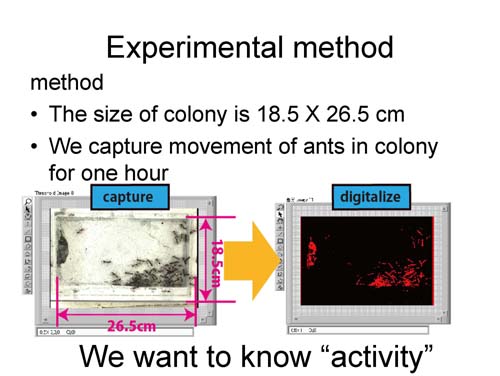
Next, I will talk about experimetal method. The size of colony is 18.5 times 26.5 cm. We capture movement of ants in colony for one hour. We want to know "acitivity" in this colony.
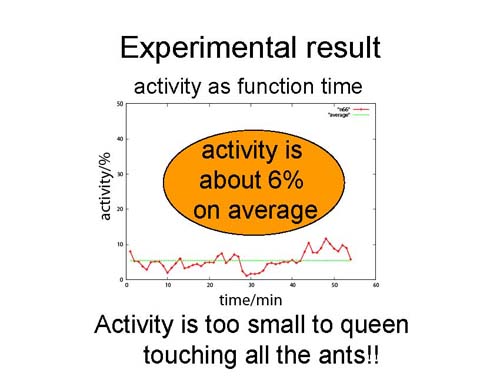
This is experimental result. X axis is time scale, Y axis is activity. This graph shows that activity is about 6% on average. Activity is too small to queen touching all the ants.
Simulation
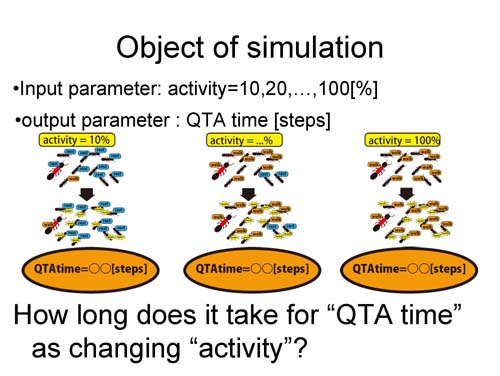
Next, I will talk about object of simulation. We want to know that how long does it take for "QTAtime" as changing "activity"? Input parameter is activity. We change it 10 , 20 , ... 100%. Output parameter is QTAtime.
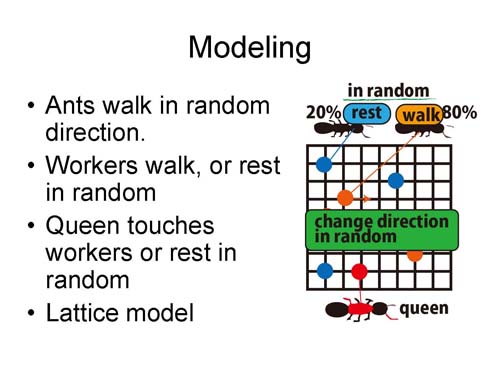
Ants walk in random direction. Worker walk, or rest in random. Queen touches workers or rest in random. We think lattice model.
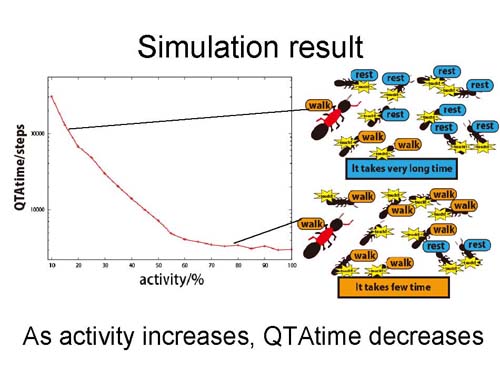
Next, I will talk about simulation result. This graph shows simulation result. X axis is activty, Y axis is QTAtime. When activity is small, QTAtime is large. And, wehn activity is large, QTAtime is small. That is to say, as activity increases, QTAtime decreases.
Disucussion
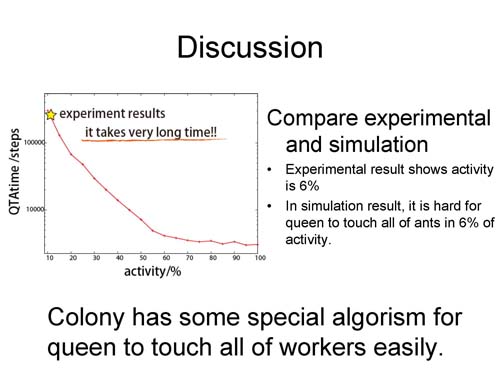
Compare experimental reslt and simulation reslut. This graph, X axis is acitvity, Y asxis is QTAtime. Experimental result shows activity is 6%(star). In simulation result, it is hard for queen to touch all of ants in 6% of actitvity(red line). And, we think colony has some special algorism for queen to touch all fo workers easily.
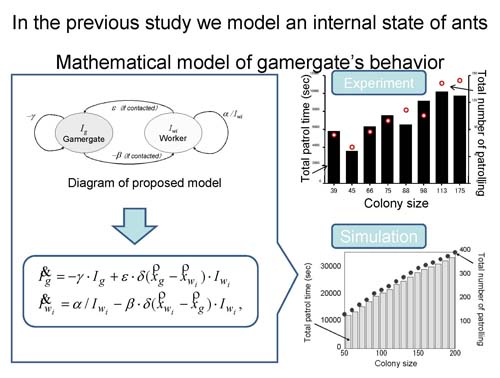
In the previous study, we model an internal state of ants mathematical model of gamergate's behavior. In experiment, as colony size increases, Total patrol time increases, too. And, in simulation , as colony size increases, Total patrol time increases, too.
Question and answer
- Q1:Why queen has to touch all the workers?
- A:(page6 I showed "IntroductionIII") All workers can queen. But when queen touches a worker, the worker stops developing ovary. So, queen has to touch all the worker, to supress development of workers ovary.
- Q2:What's your future works?
- A:(page4 I showed "view of our study")In the future work, based on experiment we will apply to robotics.


