gnuplotでアニメーション
直接 gif アニメーションを出力する
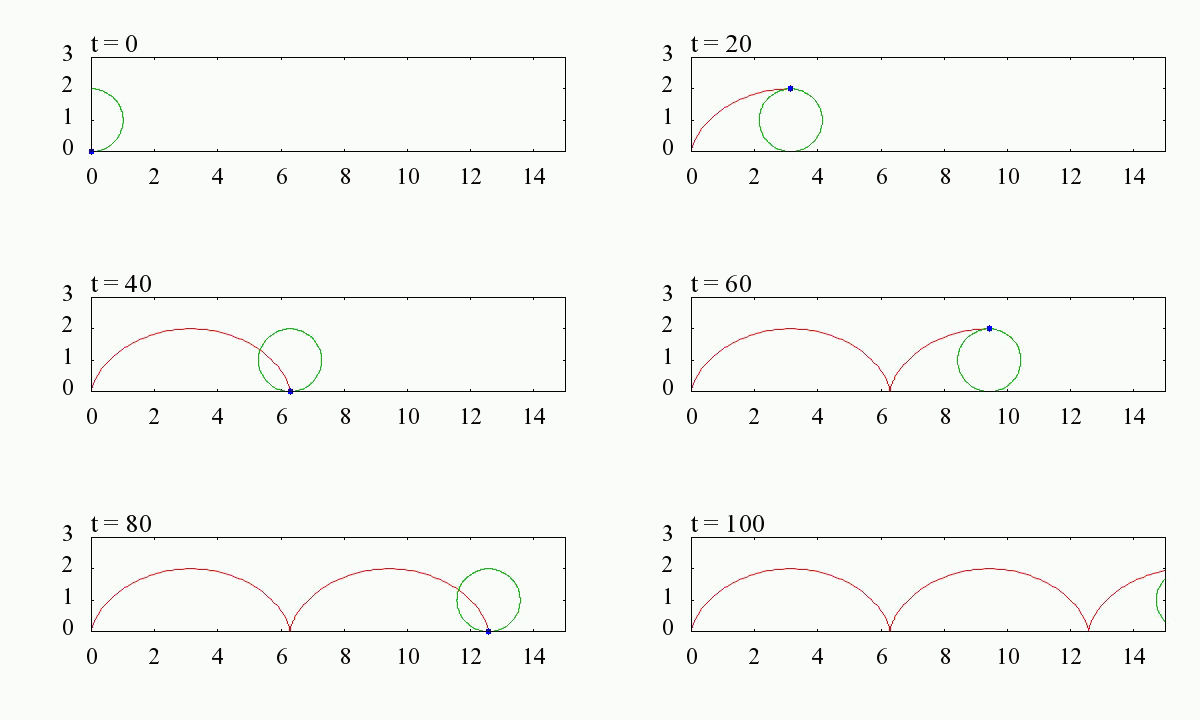
gnuplot はフリーのグラフ描画ツールですが、アニメーションも作ることができます。 gnuplot でアニメーション サイクロイド曲線では、 ファイル名が連番な jpg ファイルを書き出し、 「TMPGEnc」や「Giam」を用いて結合することでアニメーションを実現しましたが、gnuplot では直接 gif アニメーションを作成することができます。
gnuplot テンプレート
前回のサイクロイド曲線のテンプレートを改造して、gif アニメーションを作成するテンプレートを作成します。
出力ファイル名などを指定するためのメインファイルと、アニメーションを実現するために、繰り返し呼びこむことが必要なプログラム「cycloid.plt」に分けます。
set size ratio 0.2
set samples 256
set xrange [0:15]
set yrange [0:3]
set trange [0:5*pi]
set xtics 0, 2, 15
set ytics 0, 1, 3
set nokey
set parametric

set terminal gif animate optimize size 600, 240
set output "cycloid.gif"
set tics font 'Times,18'

load "cycloid.plt"
n = 0
cycloid.plt
if (exist("n")==0 || n<0) n=0 #変数の初期化
title(n) = sprintf("t = %d",n)  #タイトル名
unset label
set label title(n)  font 'Times,20'  at 0 , 3.3

theta = pi/20 * n
fx(t) = t<=theta ? t-sin(t) : 1/0
fy(t) = t<=theta ? 1-cos(t) : 1/0
plot fx(t),fy(t) w l,\
     cos(t)+theta,sin(t)+1 w l ,\
     fx(theta), fy(theta) with points pt 7 lc rgb "blue"

if (n<100)  n=n+1; reread
出力結果


